Wednesday, October 27, 2010
Isotachs

Isotach maps are maps with lines that show equal wind speeds. This map is displaying four different panels of Isotachs of North America measured at different speeds.
Isobars

An Isobar is a map that displays lines of equal atmospheric pressure. There are three rules that apply to an Isobar map; Isobar lines never cross or touch, the Isobar lines can only pass through pressures of +1000 or -1000 and lastly atmospheric pressure is shown in mb (millibars). This map is displaying the atmospheric pressure around and over Europe.
Monday, October 25, 2010
DOQQ

a DOQQ map is a pixel based image of an aerial photo in which the terrain and the displacements from the camera have been extracted. The image is a combination of a picture and the geometric aspects of a map. This image shows the areas that were impacted by Hurricane Katrina and Rita.
Friday, October 15, 2010
DEM
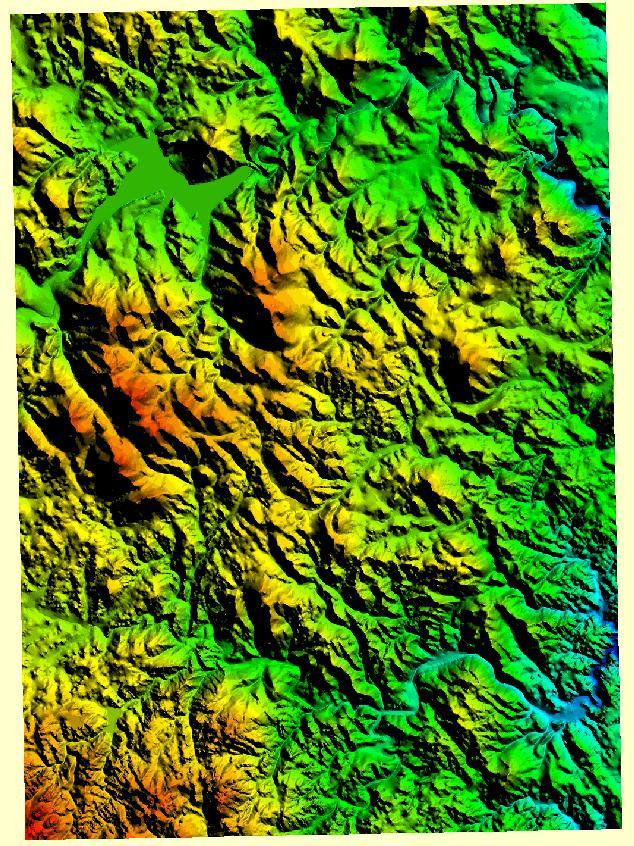
DEM stands for Digital elevation model. Its digital representation of ground surface topography. This DEM is just a sample of what a DEM would look like.
Friday, September 24, 2010
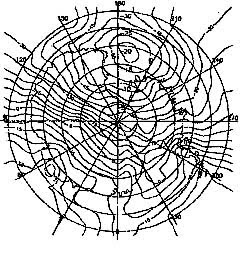
Windrose

A windrose is a tool meteorologists use to summarize the view of how fast the wind is moving and in what direction in a particular area. This picture is just an example of what windrose looks like.
LIDAR

LIDAR stands for Light Detection And Ranging. Its done by using a laser beam scanned from side to side by an aircraft that flies over an area to make an accurate model of the ground and its features. It measures between 20,000 to 150,000 points per second.
Tuesday, September 21, 2010
Infrared Aerial Photo

Infrared maps are used so that people can see the other features to the planets surface that can not be seem in regular light. this is an Infrared Aerial Photo of the Discovery Bay in The Delta National Park. It shows that there a cul-de-sac community of boat owners.
Thursday, September 16, 2010
Black and white aerial photo

Black and white aerial photos allow the mapping of a land cover and landscapes easy to understand. This photo is a aerial shot of Bryant University.
Isoline Map
Flow Maps

A Flow map is a combination of a flow chart and a map. It shows the movement of something from one place to another. This is a map of the telecommunication traffic in between countries in the European region of the world. The thicker the lines are the more call volume is experienced between countries.
Friday, September 10, 2010
Dot Distribution map

A Dot Distribution Map is a map that shows where something can be found. This map shows where duckweed can be found, and how much is in each area.
Cadastral Map

Cadastral Map is a map that shows the metes and bounds of a property. This is a balloon aerial photo of the boundaries of one property.
Planietric Map

A planimetric map is a map that is conveyed from a horizontal point of view. this map is a horizontal view of of The barracks of Fort Vancouver.
Monday, August 30, 2010
Chloropleth Map

Chloropleth maps show statistics through different shades of color on a map. This map is showing how many million gallons of water each state uses. Blue is the least and red is the most.
Hypsometric Map

A hypsometric map is a measurement of how high or low something is with images and colors. In this map the highest points, mountains, are all in blue.
Mental Map

Subscribe to:
Posts (Atom)